Spark on Microsoft Azure(3)-Using Jupyter notebook to Predict Building Temperature
这是Spark in Azure系列文章。
Spark on Microsoft Azure(1)-Create a Spark in HDInsight
Spark on Microsoft Azure(2)-Using Jupyter notebook to run a spark SQL query
此前的文章介绍了如何在Azure中创建Spark集群,以及如何利用Jupyter在Spark中运行SQL查询。这篇文章介绍如何利用Spark预测建筑的温度,即给定hvac系统id、hvac使用年份,预测建筑物的温度是上升还是下降。
前面几步与SQL查询完全一样。
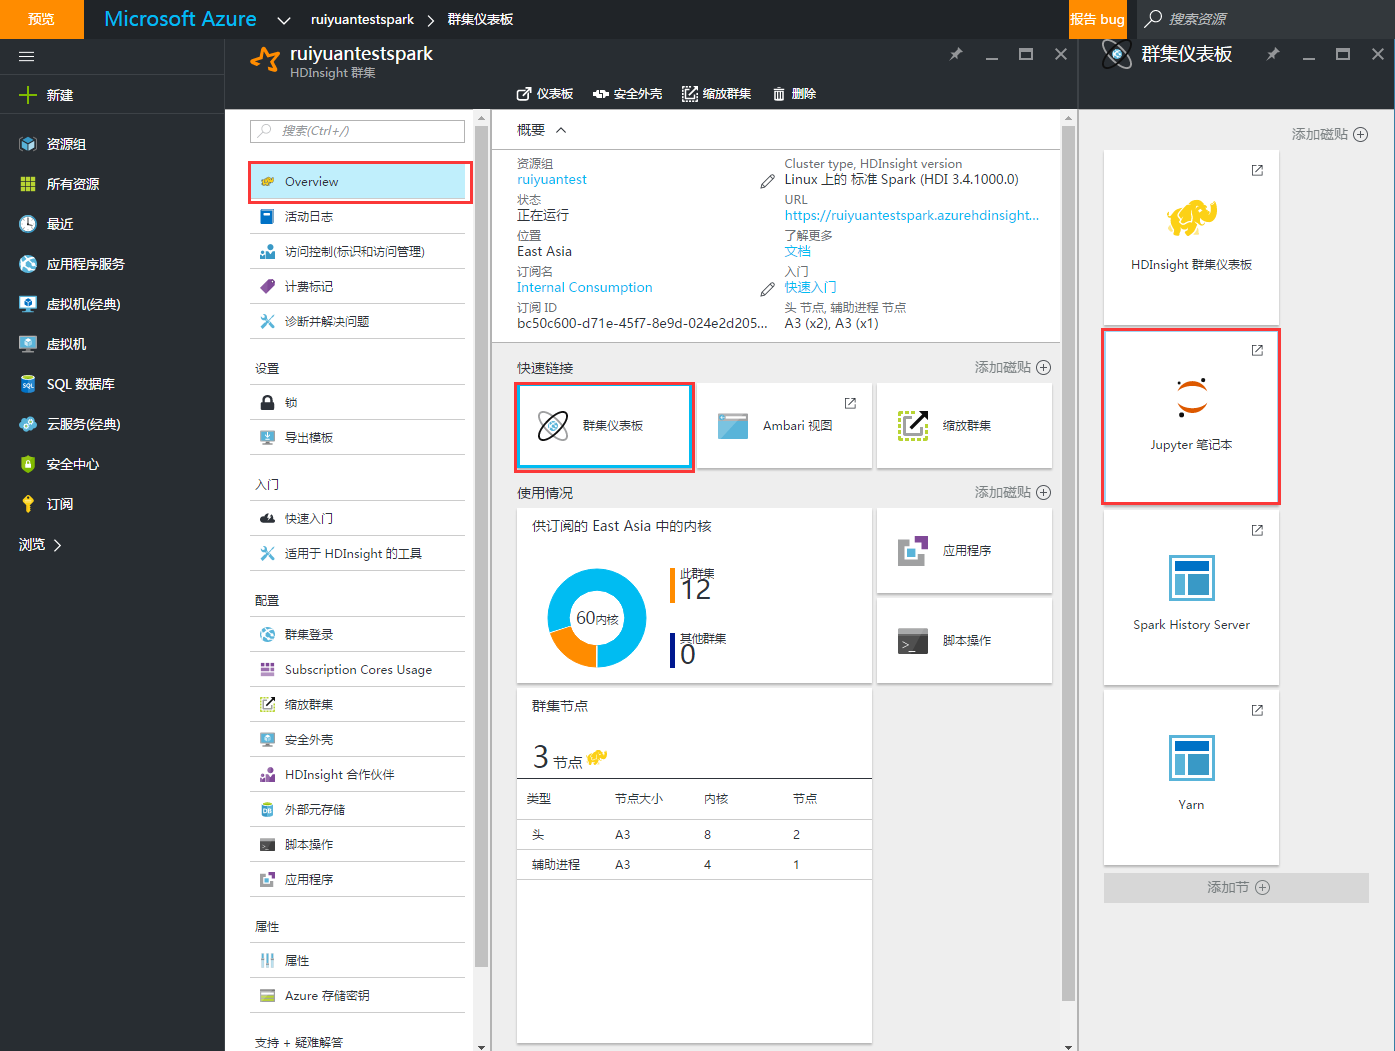
1、进入Jupyter笔记本。点击概览-》快速链接-》群集仪表盘-》Jupyter笔记本。可能需要你输入集群的用户名和密码。
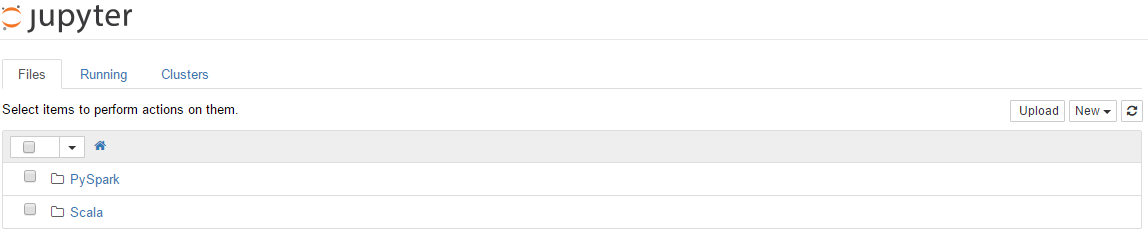
2、进入后,Jupyter笔记本的主页如下图所示。
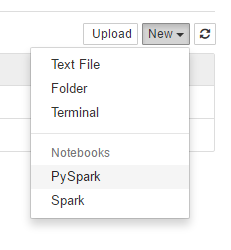
3、在Jupyter主页的右上方,点击New下拉框,选择PySpark
4、修改作业名称。本人修改为PredictTemp

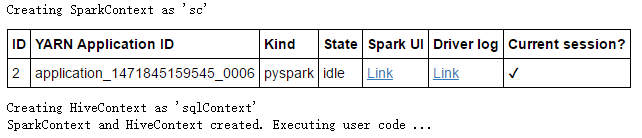
5、由于我们使用的是PySpark内核,因此我们无需显示创建运行环境,Spark和Hive会在执行第一句Python代码的时候自动为我们创建Python的运行环境。我们输入以下代码,并按SHIFT+ENTER确认。
from pyspark.ml import Pipeline
from pyspark.ml.classification import LogisticRegression
from pyspark.ml.feature import HashingTF, Tokenizer
from pyspark.sql import Row

import os
import sys
from pyspark.sql.types import *

from pyspark.mllib.classification import LogisticRegressionWithSGD
from pyspark.mllib.regression import LabeledPoint
from numpy import array
6、执行上述代码后,Jupyter输出如下所示。
7、当创建Spark集群时,会将一些示例文件拷贝到Azure Storage中。如下图所示(使用Azure资源管理器http://codebox/azexplorer浏览,也可以使用VS浏览)。这里我们使用HVAC数据进行展示。我们可以看到期内的数据格式如下所示。每列字段分别表示:日期,时间,目标温度,真实温度,HVAC系统的id,HVAC的使用年份,建筑id。
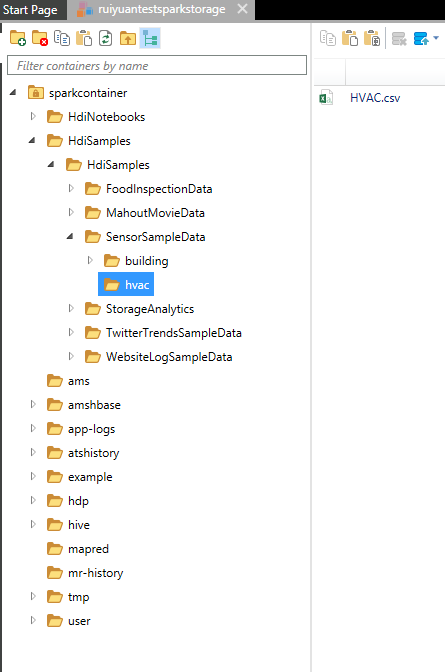
Date,Time,TargetTemp,ActualTemp,System,SystemAge,BuildingID
6/1/13,0:00:01,66,58,13,20,4
6/2/13,1:00:01,69,68,3,20,17
6/3/13,2:00:01,70,73,17,20,18
6/4/13,3:00:01,67,63,2,23,15
6/5/13,4:00:01,68,74,16,9,3
6/6/13,5:00:01,67,56,13,28,4
6/7/13,6:00:01,70,58,12,24,2
6/8/13,7:00:01,70,73,20,26,16
6/9/13,8:00:01,66,69,16,9,9
6/10/13,9:00:01,65,57,6,5,12
6/11/13,10:00:01,67,70,10,17,15
6/12/13,11:00:01,69,62,2,11,7
6/13/13,12:00:01,69,73,14,2,15
8、加载数据。由代码可知,washs:///表示映射到了Azure Storage账户中,parseDocument方法解析文件,若实际温度比目标温度高时,标记为1,否则标记为0。并将HVAC系统ID与使用年份组合成一个新的字符串。最后toDF()方法将加载的数据转化成DataFrame对象,作为训练集。
# List the structure of data for better understanding. Becuase the data will be
# loaded as an array, this structure makes it easy to understand what each element
# in the array corresponds to

# 0 Date
# 1 Time
# 2 TargetTemp
# 3 ActualTemp
# 4 System
# 5 SystemAge
# 6 BuildingID

LabeledDocument = Row("BuildingID", "SystemInfo", "label")

# Define a function that parses the raw CSV file and returns an object of type LabeledDocument

def parseDocument(line):
    values = [str(x) for x in line.split(',')]
    if (values[3] > values[2]):
        hot = 1.0
    else:
        hot = 0.0

    textValue = str(values[4]) + " " + str(values[5])

    return LabeledDocument((values[6]), textValue, hot)

# Load the raw HVAC.csv file, parse it using the function
data = sc.textFile("wasbs:///HdiSamples/HdiSamples/SensorSampleData/hvac/HVAC.csv")

documents = data.filter(lambda s: "Date" not in s).map(parseDocument)
training = documents.toDF()
9、定义Spark机器学习流水线。此流水线包括三个阶段(stage):tokenizer进行分词,即将上一步HVAC的id与使用年份组合成的字符串分词;hashingTF统计词频;lr进行逻辑回归。
tokenizer = Tokenizer(inputCol="SystemInfo", outputCol="words")
hashingTF = HashingTF(inputCol=tokenizer.getOutputCol(), outputCol="features")
lr = LogisticRegression(maxIter=10, regParam=0.01)
pipeline = Pipeline(stages=[tokenizer, hashingTF, lr])
10、拟合训练。
model = pipeline.fit(training)
11、产生测试集。
# SystemInfo here is a combination of system ID followed by system age
Document = Row("id", "SystemInfo")
test = sc.parallelize([(1L, "20 25"),
              (2L, "4 15"),
              (3L, "16 9"),
              (4L, "9 22"),
              (5L, "17 10"),
              (6L, "7 22")]) \
    .map(lambda x: Document(*x)).toDF()
12、预测。
# Make predictions on test documents and print columns of interest
prediction = model.transform(test)
selected = prediction.select("SystemInfo", "prediction", "probability")
for row in selected.collect():
    print row
13、结果分析。上述的结果如下。对于20 25实例,预测为降温(0),降温和升温的概率分别为0.5001和0.4999
Row(SystemInfo=u'20 25', prediction=0.0, probability=DenseVector([0.5001, 0.4999]))
Row(SystemInfo=u'4 15', prediction=0.0, probability=DenseVector([0.5018, 0.4982]))
Row(SystemInfo=u'16 9', prediction=1.0, probability=DenseVector([0.4787, 0.5213]))
Row(SystemInfo=u'9 22', prediction=1.0, probability=DenseVector([0.455, 0.545]))
Row(SystemInfo=u'17 10', prediction=1.0, probability=DenseVector([0.4927, 0.5073]))
Row(SystemInfo=u'7 22', prediction=0.0, probability=DenseVector([0.5017, 0.4983]))
0 条评论